Diagrams & Charts
Transform complex data and information into professional visual representations. Create and export variety of diagram types, including pie charts, bar charts, line charts and more. Ideal for analytics and reporting.
Diagrams & Charts features
Versatile visualization
• The app supports a variety of diagram types, including pie charts, bar charts, line charts, and stands out with class diagrams and bubble charts. Class diagrams simplify system organization, aiding in planning and updates. Bubble charts excel at showing data with three dimensions, ideal for comparing products or services on multiple metrics, making complex information easy to grasp.
Various formats
• Users can import data directly from spreadsheets or databases. Diagrams & Charts can effectively handle spreadsheets or databases with up to several thousand entries. This range ensures efficient processing and clarity in the resulting visuals. Export your visuals in several formats, such as SVG, PDF, and PNG, making it easy to include them in presentations or reports.
One membership, dozens of apps.
Watch the video to see how Diagrams & Charts works.
Want to try? Start with 7-day free trial!
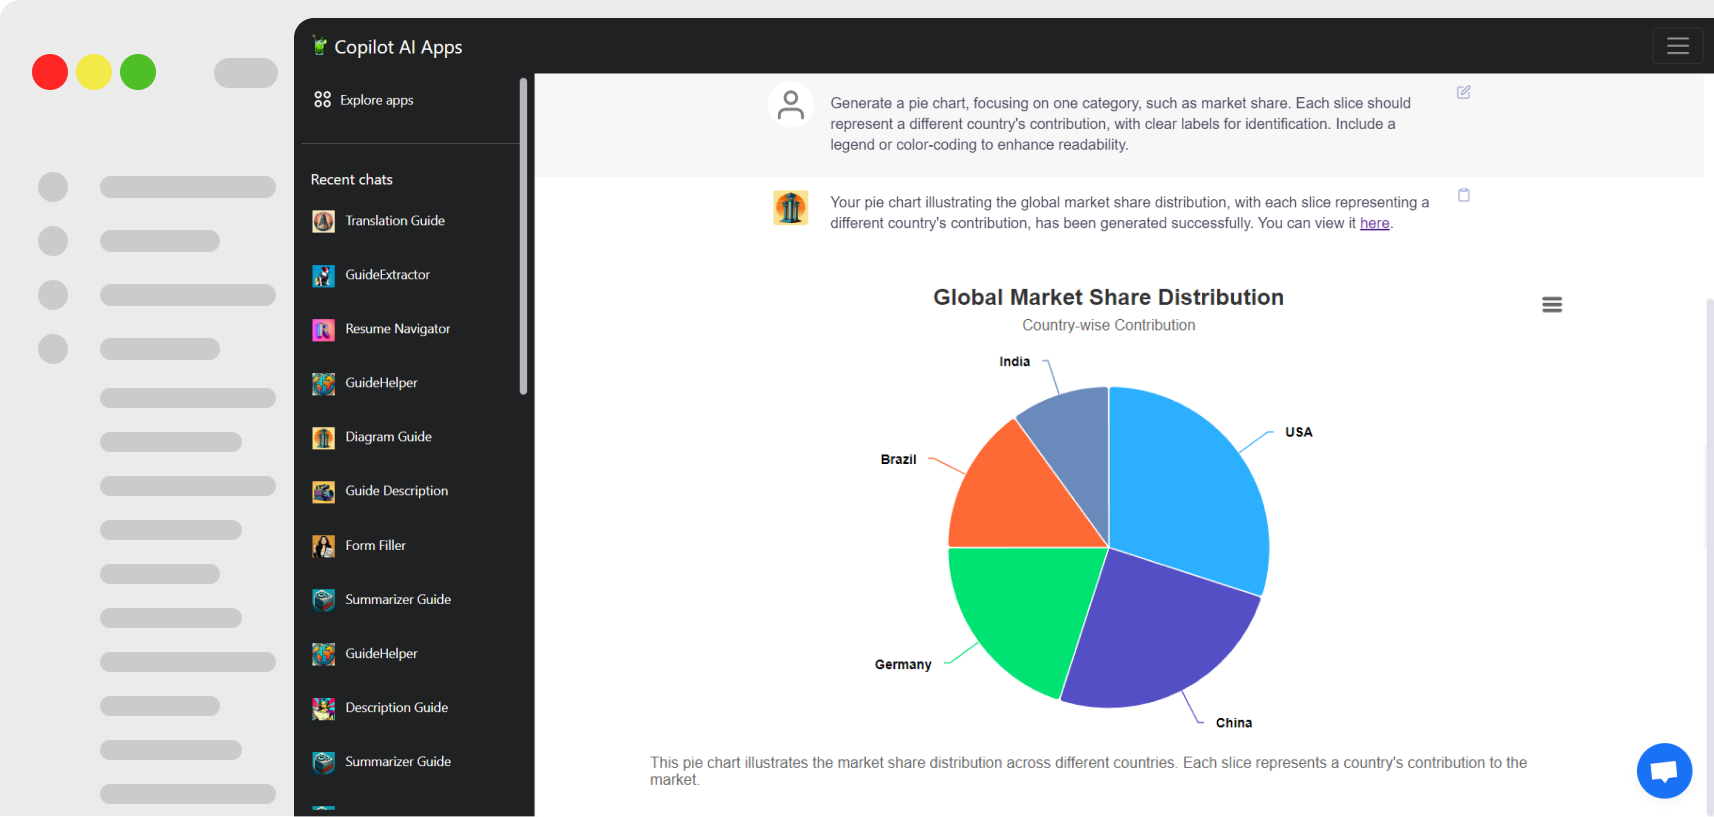
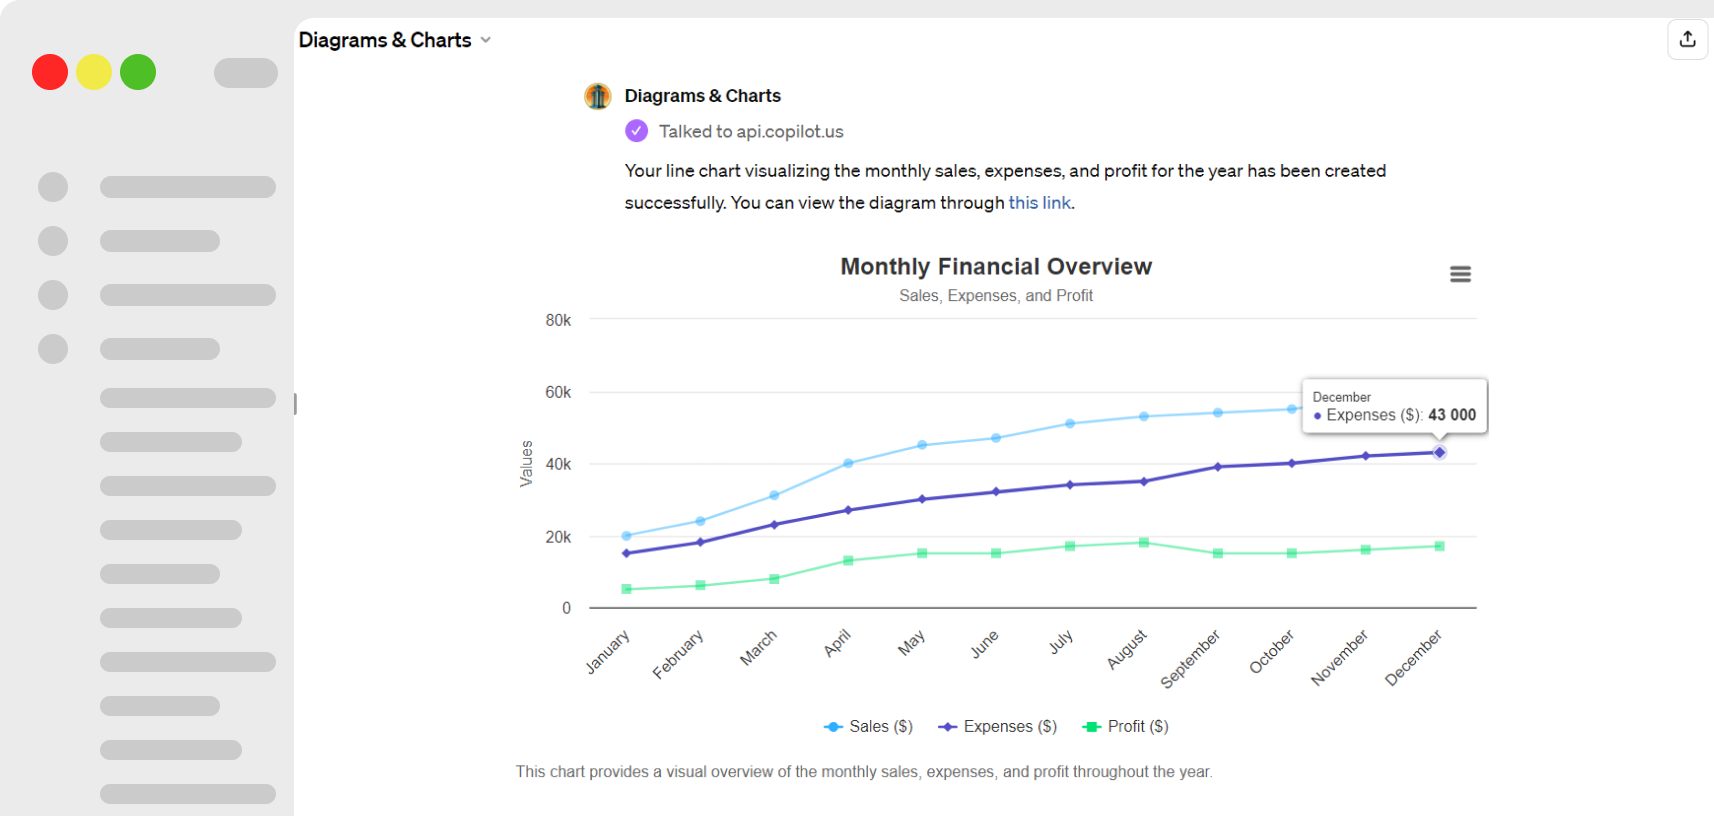
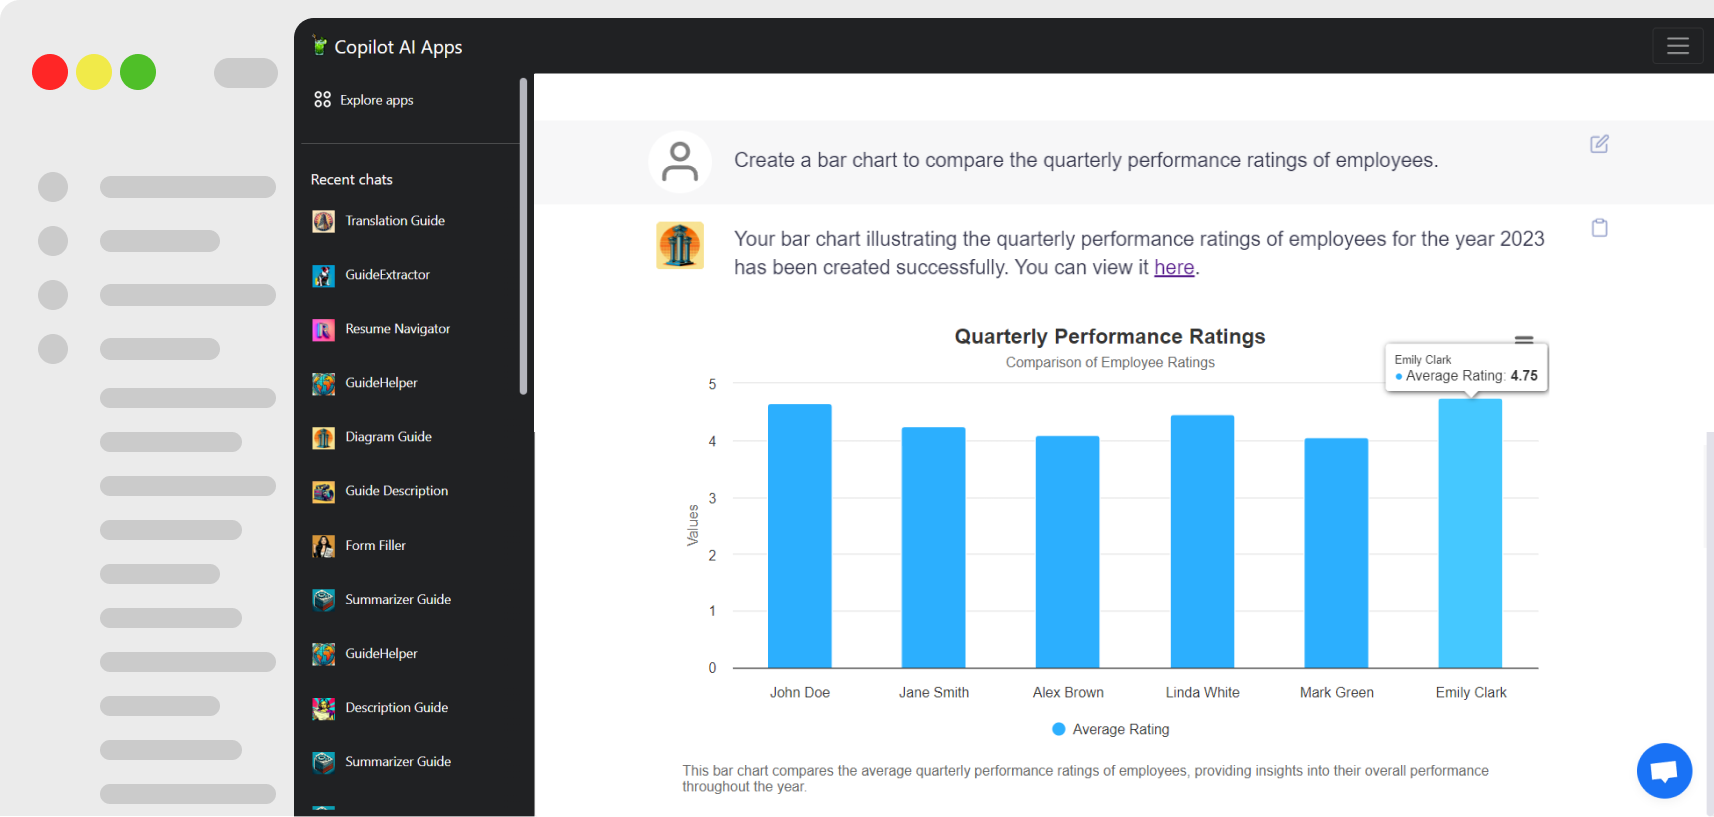
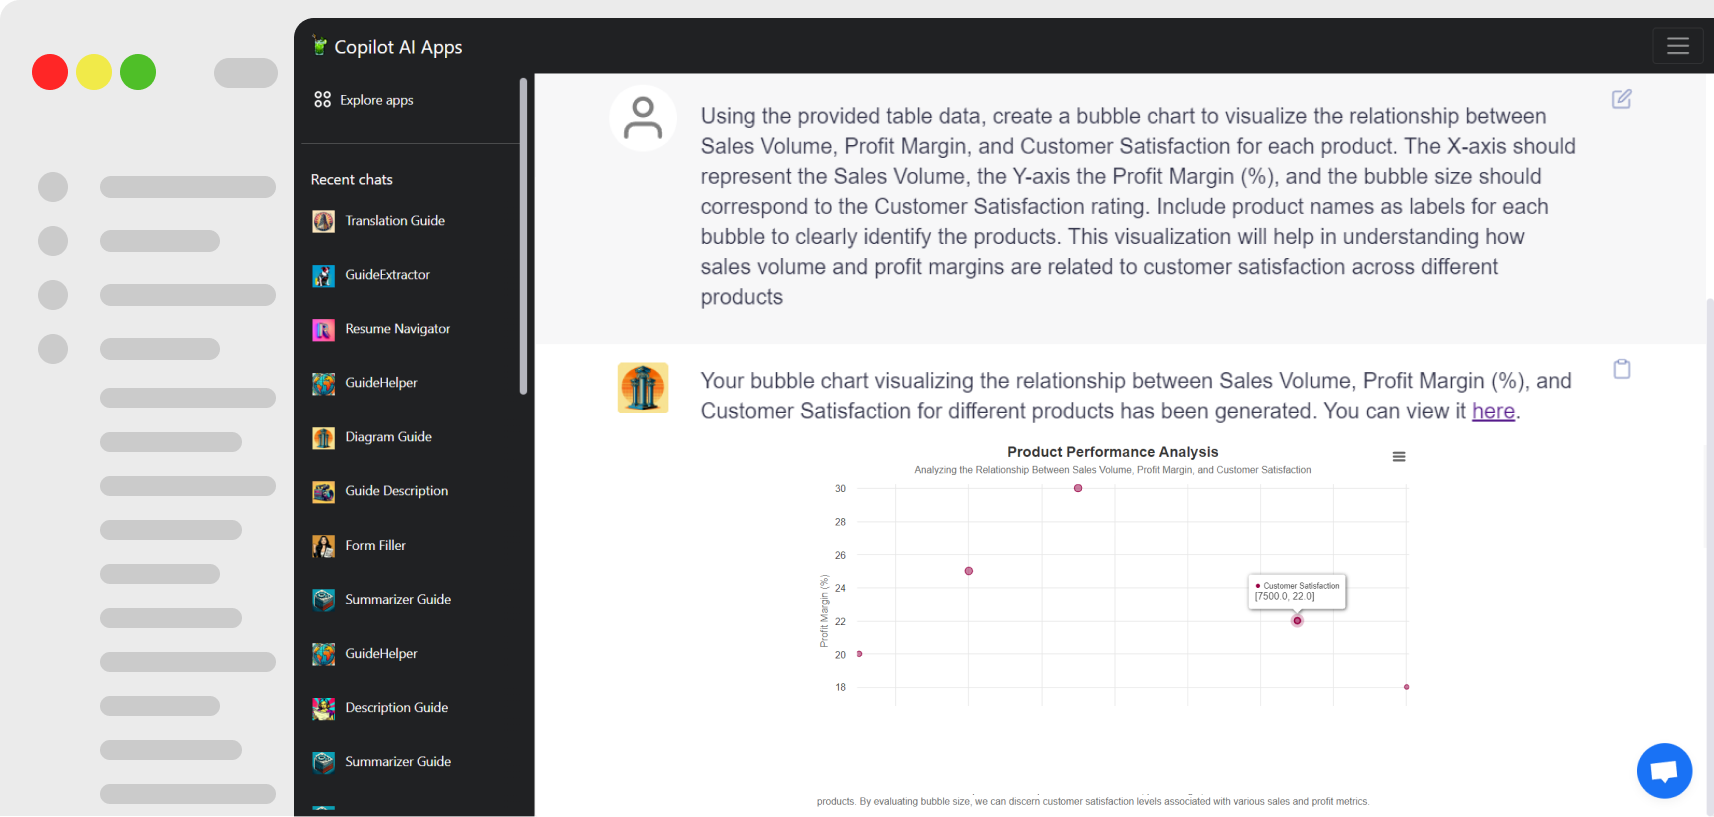
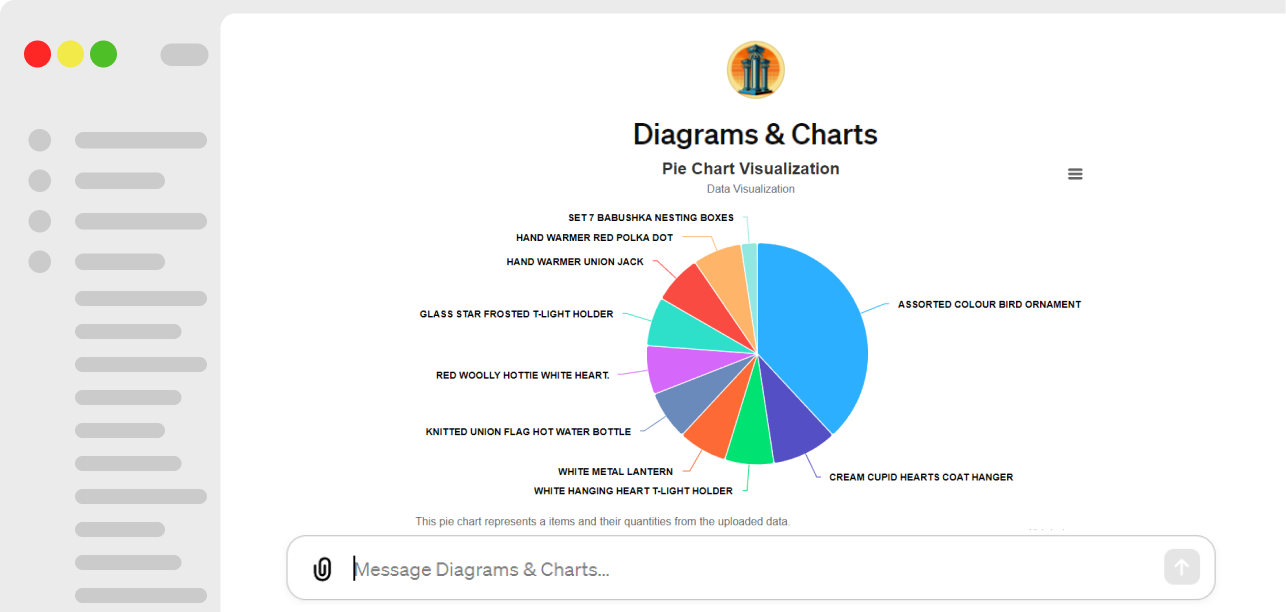
Diagrams & Charts app screenshots